

NMR compatible microfluidic platform for in situ electrochemistry
(full text and details available in our Lab Chip paper)
Combining microfluidic devices with nuclear magnetic resonance (NMR) has the potential of unlocking their vast sample handling and processing operation space for use with the powerful analytics provided by NMR. One particularly challenging class of integrated functional elements from the perspective of NMR are conductive structures. Metallic electrodes could be used for electrochemical sample interaction for example, yet they can cause severe NMR spectral and SNR degradation. These issues are more entangled at the micro-scale since the distorted volume occupies a higher ratio of the sample volume. In this study, a combination of simulation and experimental validation was used to identify an electrode geometry that, in terms of NMR spectral parameters, performs as well as for the case when no electrodes are present. By placing the metal tracks in the side-walls of a microfluidic channel, we found that NMR RF excitation performance was actually enhanced, without compromising B0 homogeneity. Monitoring in situ deposition of chitosan in the microfluidic platform is presented as a proof-of-concept demonstration of NMR characterisation of an electrochemical process.
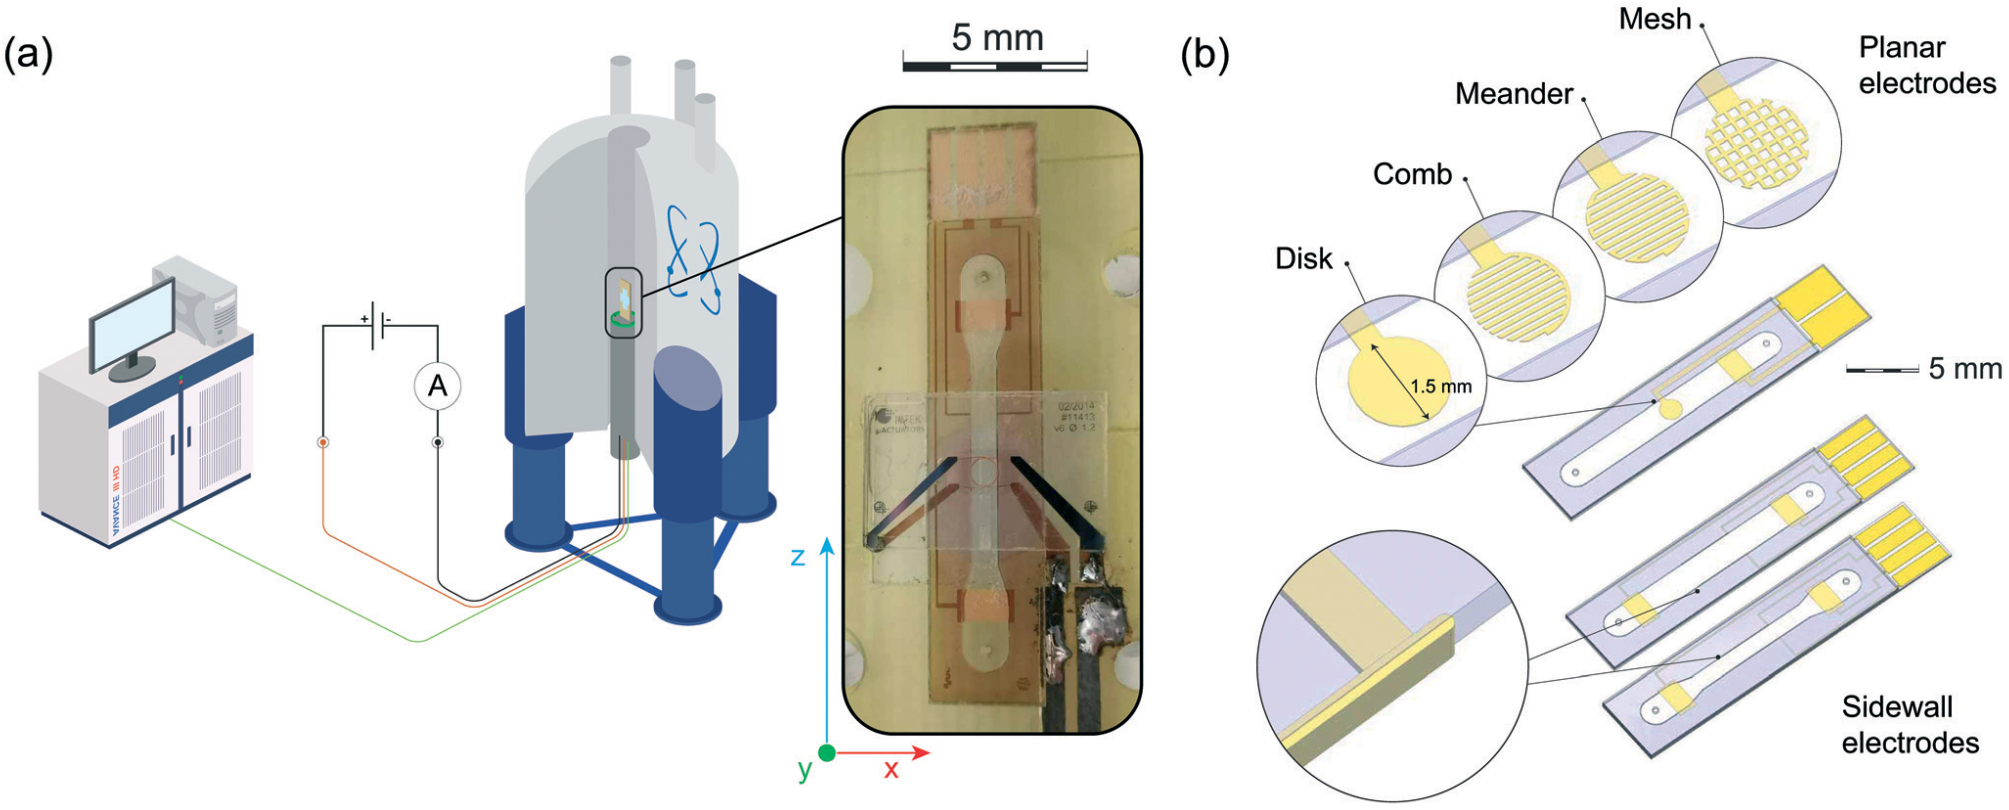
Figure 1: (a) Illustration of the setup for in situ electrochemistry using a commercial superconductive NMR/MRI system equipped with a micro Helmholtz coil, being tuned and matched at the 1H Larmor frequency, and a sample insert containing metallic electrodes. (b) Different sample inserts employing different electrode configurations, i.e., a planar active electrode (a disk, a comb, a meander, and a mesh geometry), narrow- channel sidewall electrodes, wide-channel sidewall electrodes (more Info).
B1 maps, collected from MRI experiments, for all different configurations are presented in Fig. 2a. Fig. 2b depicts the profile of the B1 field along the x-axis at the middle of the detection zone. For the narrow channel insert, the measurements confirmed that the field homogeneity was enhanced and that a steep drop of the field happened as the sample volume was restricted by the metallic sidewall electrodes. The B0 patterns at the sensitive zone of the coil are presented in Fig. 2c, showing that the planar 34 nm electrode distorted the static field especially at the top and bottom edges of the electrode, which perfectly aligned the material interface intersections with B0. The ultra-thin electrodes (3 nm thickness) introduced less perturbations; however, the overall pattern appeared similar as expected. These distortions are likely introduced because of the chromium seed layer. Conversely, the narrow channel sidewall electrodes had almost no effect on the overall field pattern, except for the left and right edges where the 1H NMR signal was excluded due to the presence of the electrodes.
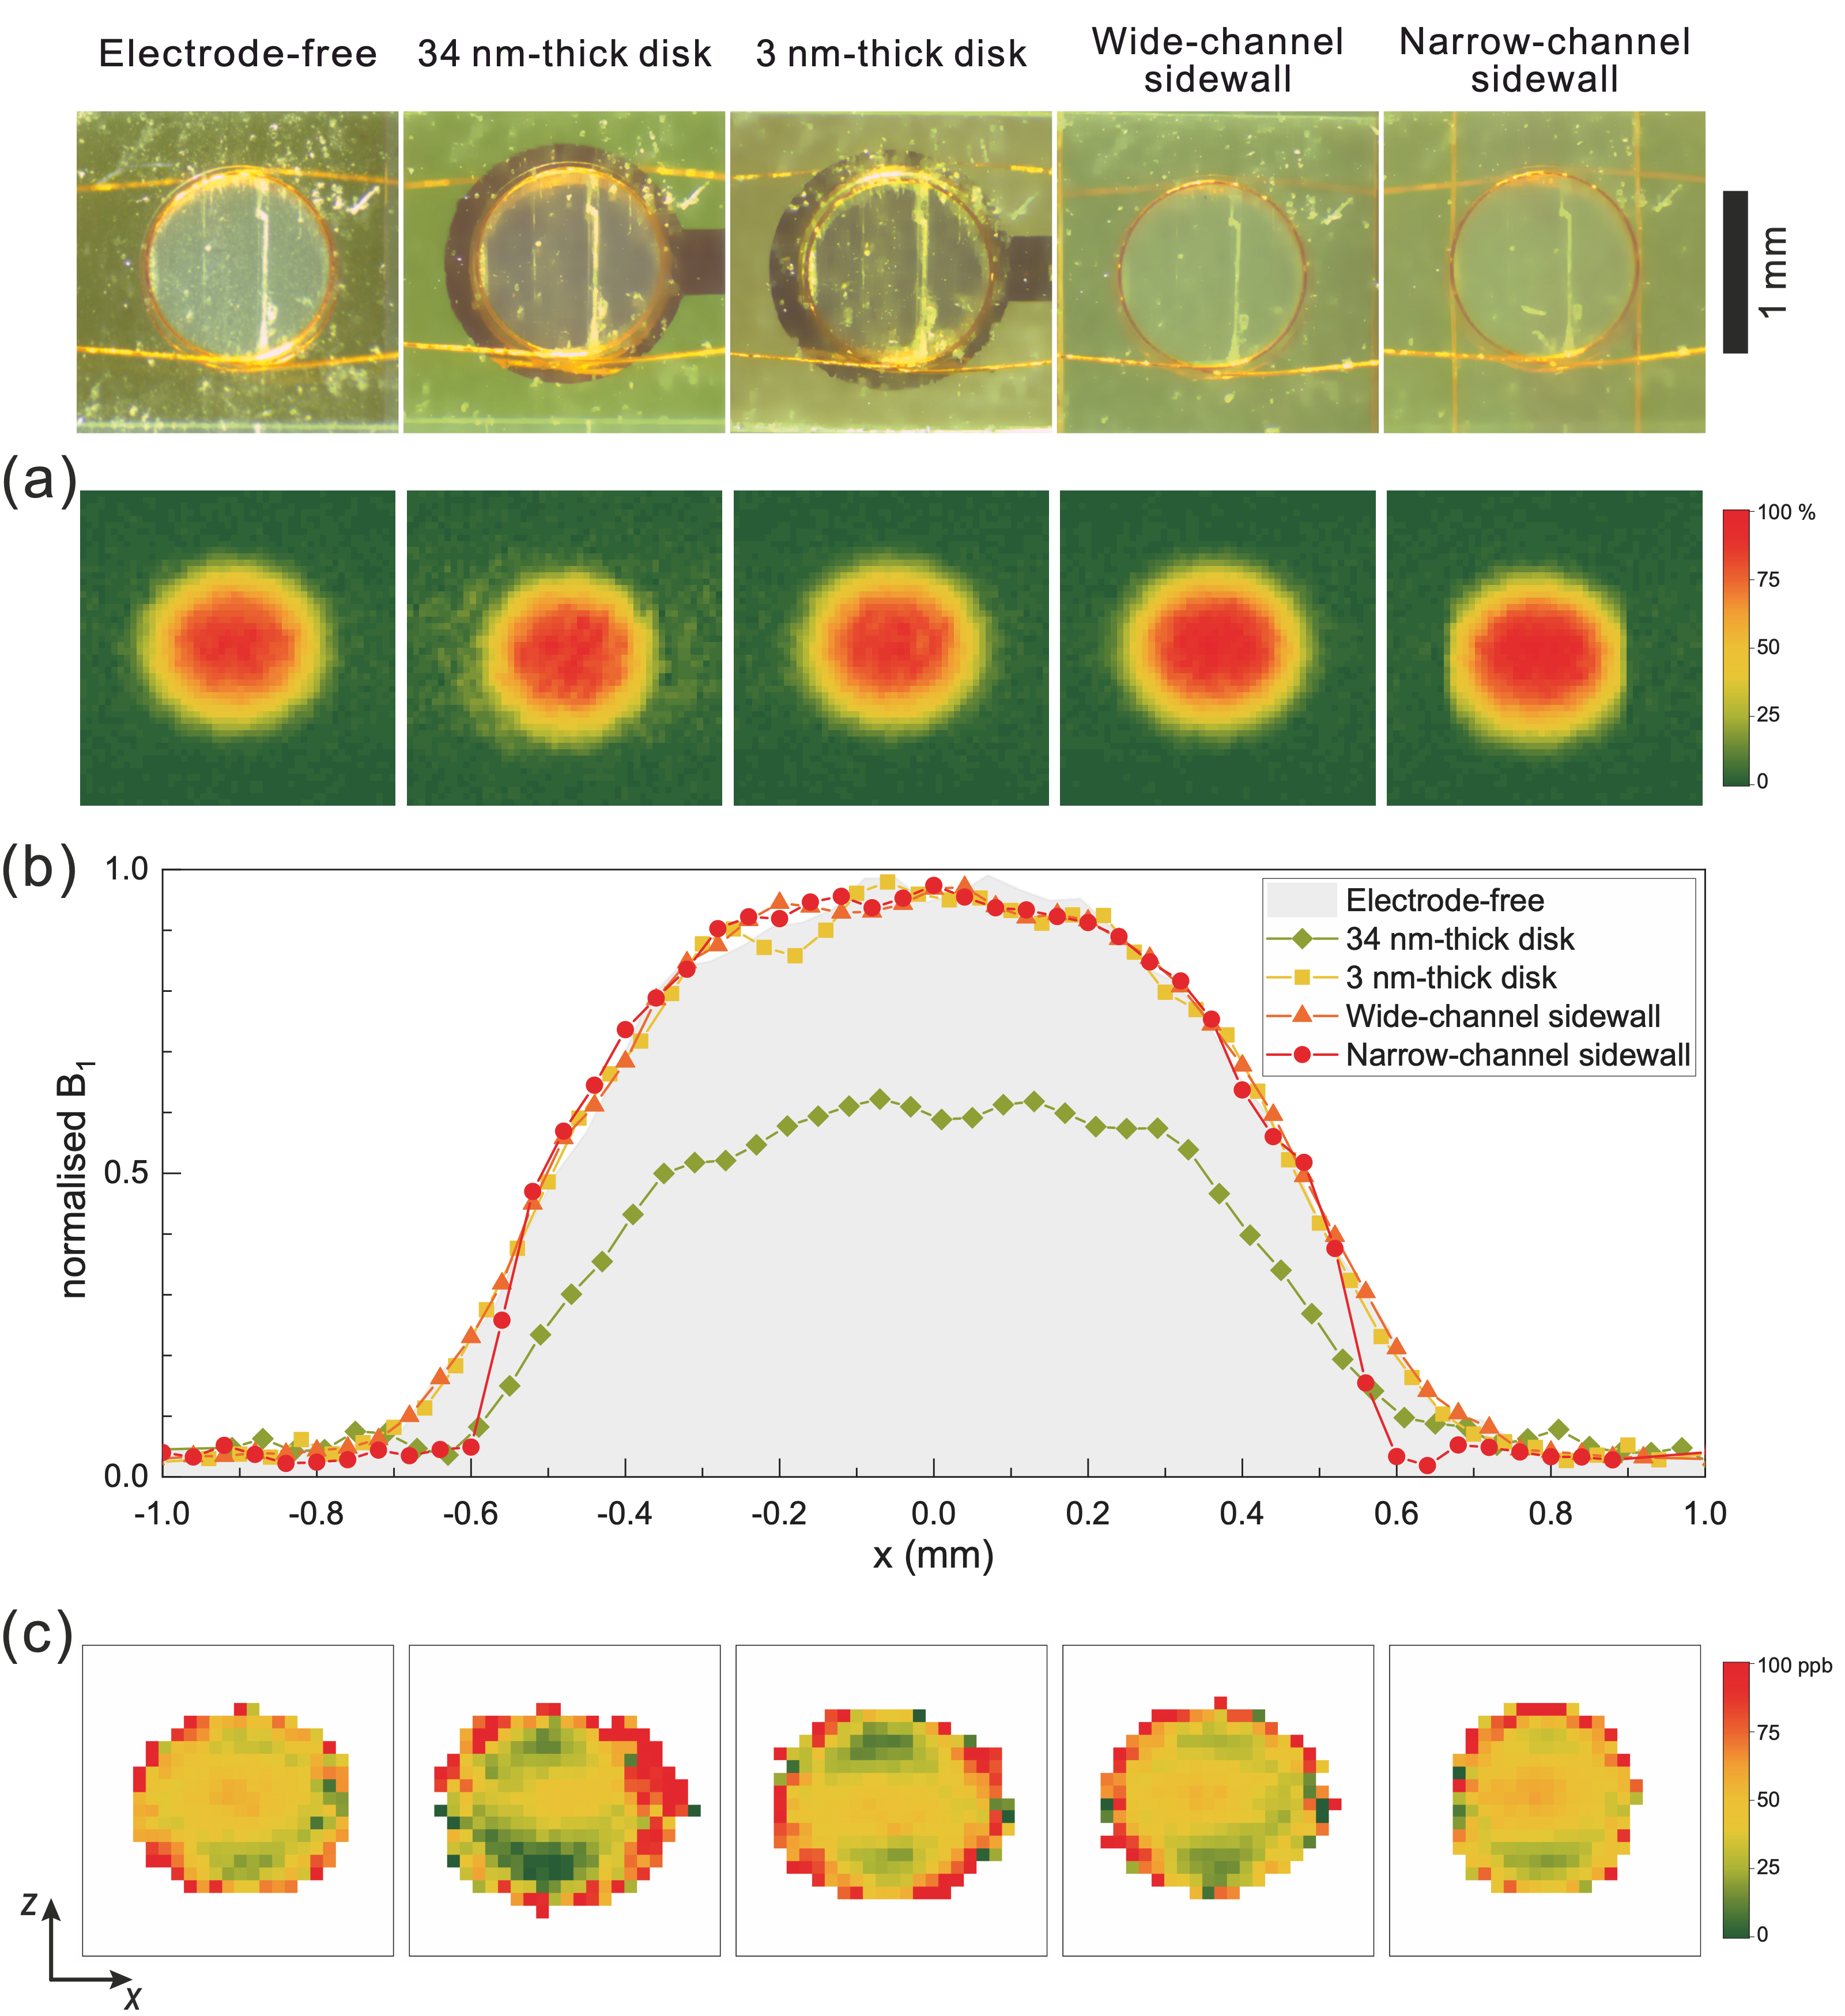
Figure 2: (a) Normalised distribution of the B1 field (%) at the sample volume excited with 19.2 μW power for different types of inserts. (b) Normalised profile of B1 along the x-axis at excitation power of 19.2 μW. (c) B0 field map at the detection zone of the coil (https://pubs.rsc.org/en/content/articlepdf/2020/lc/d0lc00364f).
Using this electrode configuration, the compatibility of an electrochemical experiment with NMR spectroscopy within a LOC environment was demonstrated using chitosan electrodeposition. This experiment is attractive first because of its relative simplicity, requiring only a voltage applied between two electrodes to initiate water hydrolysis, resulting in a local pH gradient as required for chitosan hydrogel deposition. Second, the NMR spectrum of chitosan in solution is significantly different compared to the gel state, and thus the deposition process, as a function of time, can be monitored.
The 1H NMR signals from chitosan in solution are clearly visible in the chemical shift range 3 to 4 ppm (pink region in Fig. 3a). As expected, these signals begin broadening as a function of deposition time. The broadening results from constrained molecular motion as would be expected in the hydrogel state. A similar result was observed for chitosan when modified with poly(ethylene glycol) (PEG) (Fig. 3c and d). In contrast, the PEG signal (∼3.8 ppm and ∼3.3 ppm, blue region) remained relatively sharp as the hydrogel was formed, suggesting this highly hydrated polymer maintained a degree of molecular motion. This was an interesting result, since bi-functional PEG can be used to attach interesting molecules to chitosan, which would then be potentially decoupled from the deleterious line-broadening effects when deposited as the hydrogel.
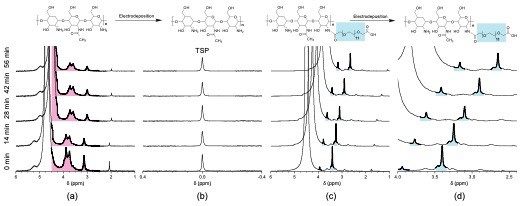
Figure 3: In situ 1H NMR monitoring of chitosan (CS) electrodeposition using the narrow channel sidewall electrode configuration. Results for unmodified CS. (a) CS chemical shift region (pink highlight); (b) TSP signal 0 ppm. Results for CS–PEG: (c) CS–PEG signals (PEG signals in blue highlight); (d) zoom of 2.6–4.0 ppm region to highlight the PEG signals. The time interval between each spectrum was determined by a 5 min delay + 9 min NMR acquisition. In both cases, the water resonance was observed to shift due to a change in pH. The current used to drive electrodeposition was applied during the entire experiment (https://pubs.rsc.org/en/content/articlepdf/2020/lc/d0lc00364f).
Additionally, we have demonstrated NMR monitoring of the activity of enzymes immobilized in chemically distinct layers within a multi-layered chitosan hydrogel assembly. As a benchmark, we observed the parallel activities of urease (Urs), catalase (Cat), and glucose oxidase (GOx) by monitoring reagent and product concentrations in real-time. Simultaneous monitoring of an independent enzymatic process (Urs) together with a cooperative process (Gox + Cat) was achieved, with chemical conversion modulation of the Gox + Cat process demonstrated by varying the order in which the hydrogel was assembled (full info).
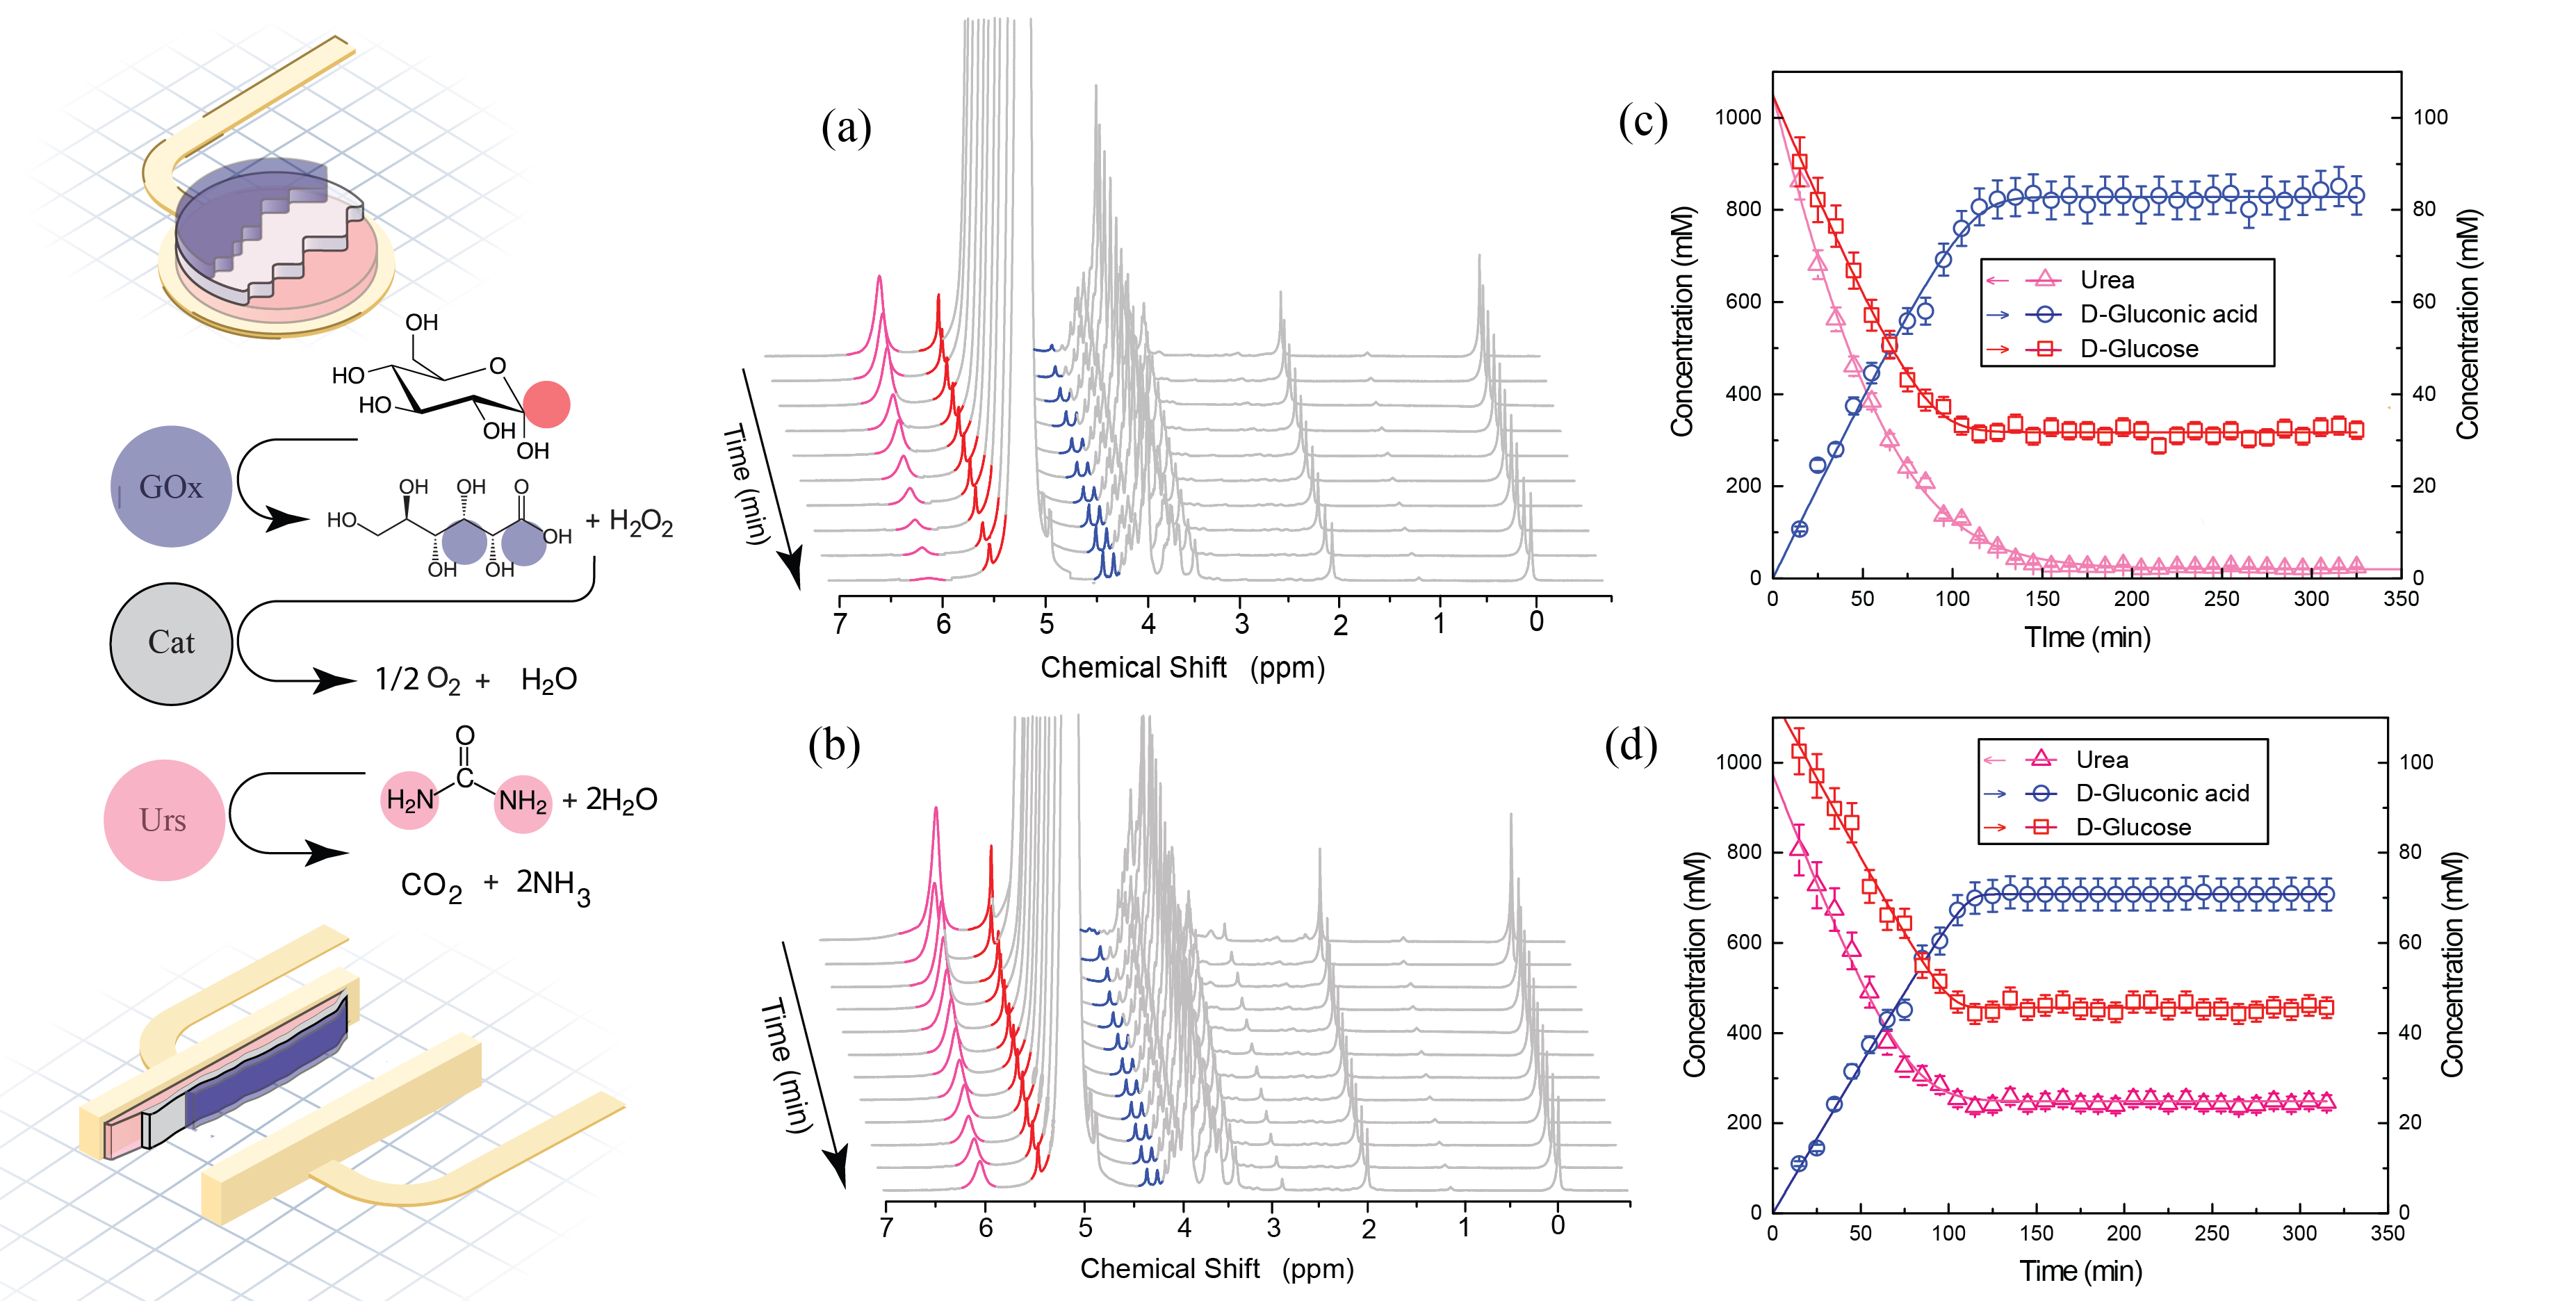
Figure 4: Left: the enzymatic reactions performed with Urs-Cat-GOxhydrogel. Position of NMR- integrated hydrogens are highlighted in red (glucose), blue (gluconic acid), and pink (urea). The arrangement of the hydrogel assembly is displayed for the case of a planar electrode (top) and a sidewall electrode (bottom). Gel layers have been colored in blue for GOxhydrogel, gray for Cathydrogel, and pink for Urshydrogel. a), b) Representative 1H NMR time series of Urs and GOx enzymatic reactions. Experiments were performed on a) a planar electrode and b) a sidewall electrode. Signals are colored according to the color coding on the left (urea at 5.8 ppm, the glucose signal at 5.3 ppm, the gluconic acid signal at 4.2 ppm). c), d) Concentration time series of reactants and products extracted from NMR spectra in (a) and (b), by integrating NMR signals in the highlighted regions. Left axis: concentration of urea; right axis: concentrations of both glucose and gluconic acid. Solid lines are best-fit curves to the Michaelis–Menten kinetic model (full info).